
In today’s interconnected markets, everything is linked. A single move in oil prices can set off a precise chain reaction that flows through inflation, bond yields, liquidity conditions, and finally into risk assets like stocks and growth equities.
Think of it as a domino effect. When the first piece (oil) falls, everything else follows with mechanical precision.
The Chain Reaction: Step by Step
1. Oil → Inflation
Oil is not just another commodity — it is the foundational input cost of the global economy. It powers transportation, manufacturing, food production, fertilizers, and logistics.
When oil prices rise:
- Shipping and freight costs climb
- Production expenses increase across industries
- Food prices follow as agricultural and distribution costs rise
Result: Broad-based inflation pressures build quickly and spread through the entire economy.
2. Inflation → Yields
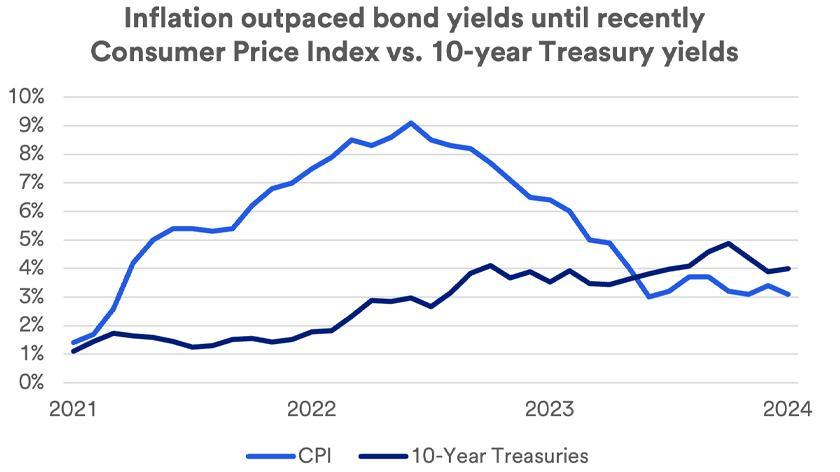
Bond investors react immediately to rising inflation because bonds pay fixed nominal returns. Inflation erodes the real value of those payments, so investors demand compensation in the form of higher interest rates.
Result: Treasury yields rise — most notably the benchmark 10-year U.S. Treasury yield — as markets price in a less accommodative environment.
3. Yields → Liquidity
Higher yields translate directly into a higher cost of capital across the economy. Mortgages become more expensive, corporate borrowing slows, businesses cut expansion plans, and investors become more cautious with new risk exposure.
Money flows less freely. Credit tightens.
Result: Liquidity in the financial system contracts.
4. Liquidity → Risk Assets
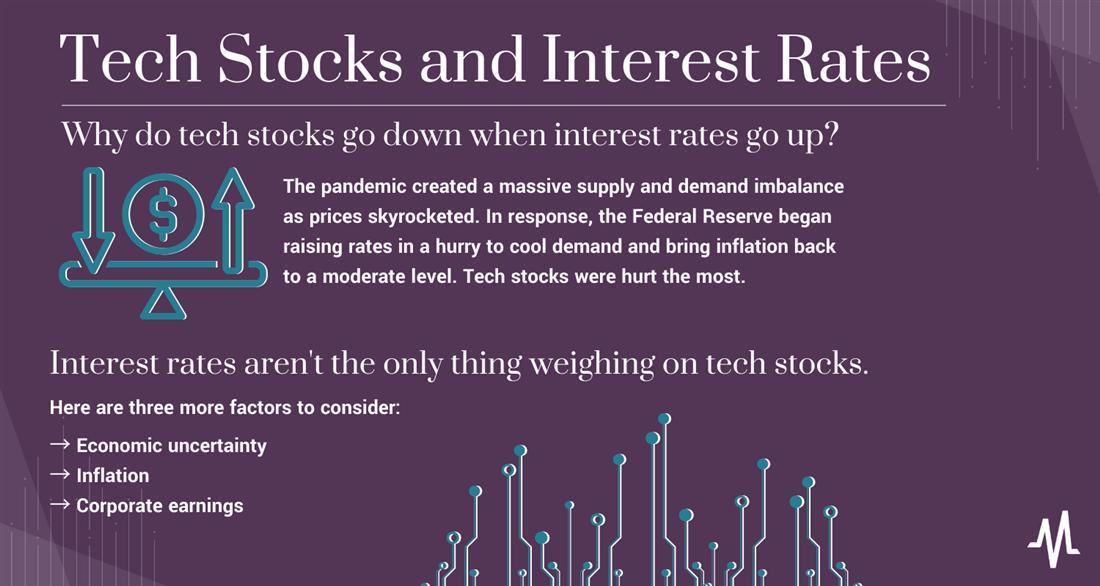
Stocks, cryptocurrencies, growth technology, and other risk assets thrive in an environment of abundant liquidity. When liquidity tightens:
- Investors pull back from speculative positions
- Valuations compress
- Market sentiment shifts from risk-on to risk-off
Result: Risk assets sell off, often sharply and quickly.
The Full Picture — Why This Matters Right Now
Put the pieces together and the implication is clear:
If oil spikes → inflation rises → yields rise → liquidity tightens → risk assets fall.
This is exactly the setup markets are navigating today. Geopolitical tensions in the Middle East — particularly risks around energy infrastructure and supply routes — create the potential for an oil price breakout. Meanwhile, the broader market rally has largely been built on the assumption that oil remains contained.
In other words, the entire equity market is effectively betting that oil does not break higher.
The one line that matters: Oil is the trigger. Liquidity is the transmission mechanism. Markets are the outcome.
Exact Levels to Watch: Your Domino Monitor
Oil (WTI Crude)
- $75–77 → Neutral / balanced zone
- $80 → First pressure point (inflation starts creeping)
- $85–87 → Stress zone (market starts noticing)
- $90+ → Trigger zone
- $100+ → System-level problem
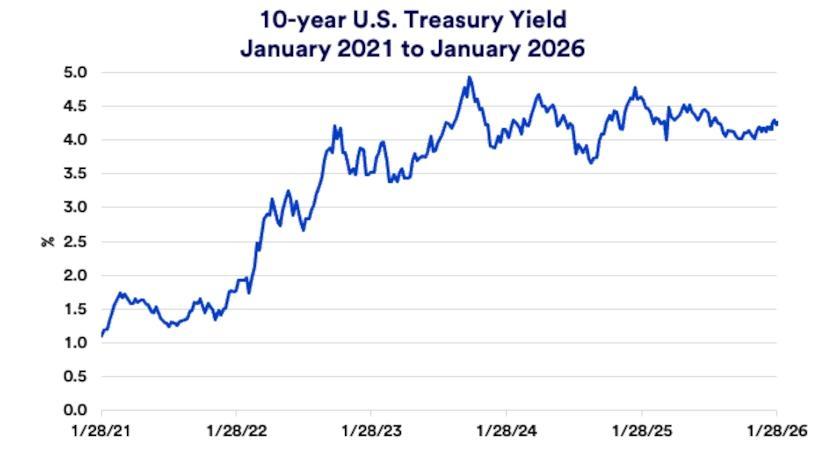
10-Year Treasury Yield (US10Y)
- 3.75–4.00% → Stable zone
- 4.25% → First tightening signal
- 4.50% → Financial conditions tightening
- 4.75–5.00% → Market stress zone
S&P 500 (SPX)
- 5000 → Psychological + structural support
- 5100–5150 → Range control zone
- 5200–5250 → Overextension zone
- 5300+ → Blow-off / squeeze territory
The Intermarket Trigger Map
| If This Happens | Then Expect This |
|---|---|
| Oil > $85 | Inflation fears rise |
| Oil > $90 | Yields spike |
| Yields > 4.5% | Liquidity tightens |
| Liquidity tightens | SPX struggles |
| SPX < 5000 | Risk-off cascade |
This map is your real-time dashboard. Watch the sequence — it rarely skips steps.
How Smart Money Is Actually Positioning
Professional investors are not making one-way bets. They are participating in the upside while systematically hedging the chain reaction.
Key hedges include:
- Long Oil or Energy stocks — direct geopolitical and inflation hedge
- Long Gold — benefits from inflation, fear, and any currency stress
- Long Volatility (VIX calls) — cheap insurance that pays when markets break
- Short Duration / Bond puts — profits directly from the inflation → yield spike
- Tactical Equity hedges (SPX puts) — downside protection without abandoning the broader trend
Their real positioning: Long the rally… hedged for chaos. Not all-in bullish. Not all-in bearish. Simply protected.
Simple Version: Bull Case vs. Bear Trigger
Bull Case (market grinds higher):
- Oil stays below $80
- Yields stay below 4.25%
- SPX maintains upward momentum
Bear Trigger (things move fast):
- Oil breaks above $90
- Yields push above 4.5%
- SPX loses 5000
Final Insight
The market is not being driven by corporate earnings or individual stocks right now. It is being driven by oil and bonds. Stocks are simply reacting to the upstream dominoes.
Understanding this chain gives you clarity in a noisy market. It shifts the question from “What should I buy?” to “Where are we in the domino sequence?”
What are your thoughts? Are you watching the oil-yield relationship as closely as the headline indices? Have you adjusted your portfolio for this potential chain reaction? Drop your perspective in the comments.
This analysis is for informational purposes only and does not constitute investment advice.