 Extreme weather conditions
All across the world, food crops are being destroyed by floods, drought, and cold weather. North Korea is facing serious food shortages as a result of little to no rainfall in 2019. Leading into May 2019, the U.S. experienced the wettest 12 months in its history. More than 100 rivers and stream gauges have reported moderate to major flooding. These extreme rainfall events have resulted in numerous cornfields underwater and cool, wet soils are a paradise for soil pathogens. The flooding in Nebraska has resulted in farmers only planting less than half of the corn than normal by this time of the year. France is the third-largest corn exporter in the world and has seen a cold snap in late April to mid-May (key planting window). The extreme weather conditions have affected agriculture production worldwide. Higher food prices should follow.
Teucrium Corn Fund
Corn is prevalent and widely used in our daily lives throughout the global economy. The price of corn normally hangs about its cost of production for long periods until it surges higher as a result of a weather event. We took a position in the Teucrium Corn Fund (CORN) which is traded on the New York Stock Exchange on 29 March with an entry point at $15.23. We have seen a 9% gain since that date.
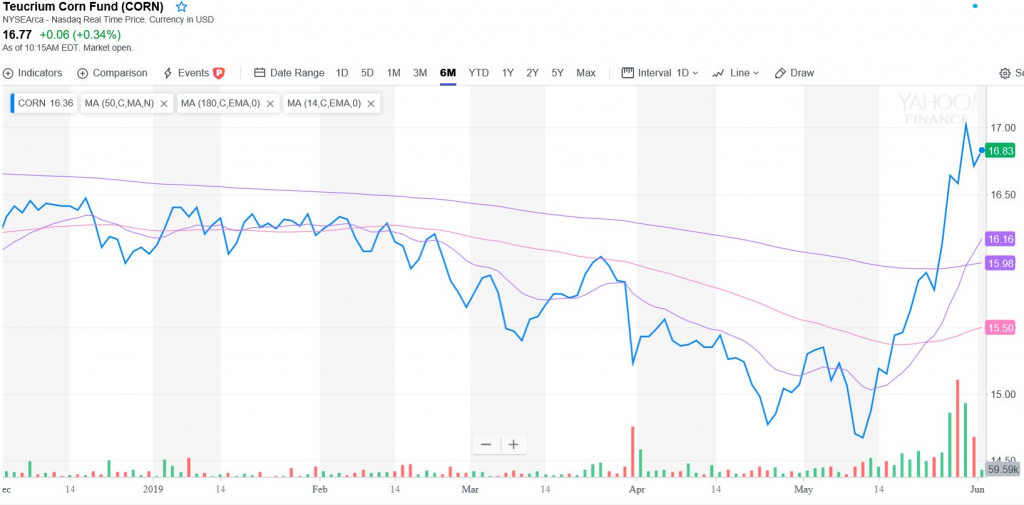
Looking at the following 6-month chart, we can see rising green bars at the bottom of the chart which represents increased accumulation into CORN in the latter part of May. CORN may be due to a short-term correction here after the recent run-up in price.

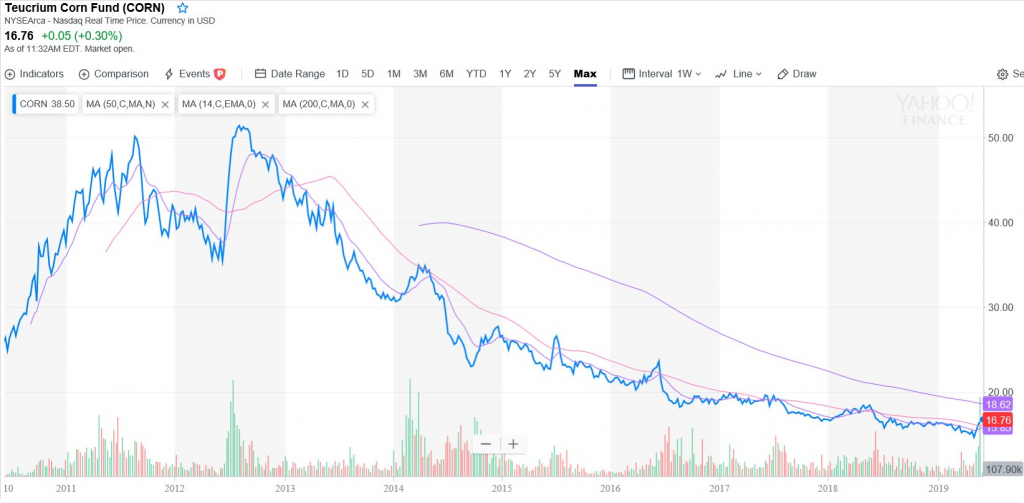
The CORN ETF provides investors unleveraged direct exposure to this important soft commodity without the need for a futures account. CORN gets even tastier when we view it on a longer-term chart.
We can see the upside potential that the current weather events may cause.

The Technicals
As you can see in the first chart, the increased buying volume lately has caused the price to rise above both the 14-day and 50-day moving averages. We are now closing in on the 200-day moving average which is currently at $18.62 at which point we may see more institutional money join the party. However, CORN is looking frothy now and is possibly due to a short-term correction. The 200-day moving average on the 6-month chart has been recent resistance so it is potentially now support at $16 (potentially a nice entry point from a shorter-term perspective).
On the longer-term chart, the 200-day moving average appears to be flatlining and the rising buying volume levels appear to be confirming our fundamental reasons to be long CORN. We do have some resistance around $18.45 and again at the $20 region. From a longer-term value perspective, we believe CORN is very cheap considering the extreme weather conditions mentioned above and from previous price action in 2011-2013.